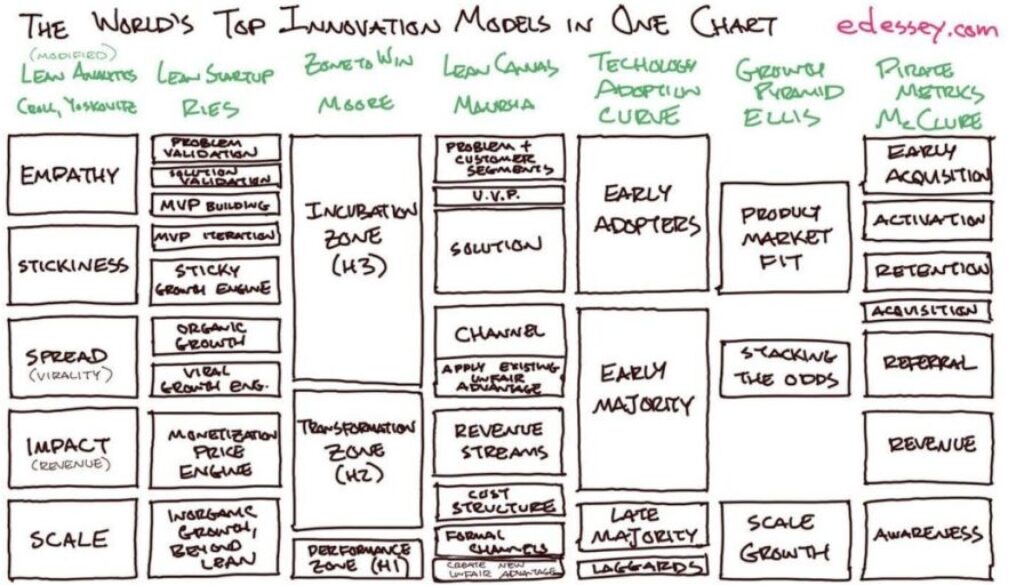
The World’s Top Innovation Models in One Chart
This week I was honored to speak at the Innov8rs community event Connect: Business Design & Venture Building. It featured a great group of folks around the world. In my talk, I built on some of the stuff that I’ve already written about here like How to Create Pathways for Innovation in Your Organization, The Challenges and Strengths of Corporation Incubation, and How to Unlock Innovation Growth with Fruit, Trees, and Soil.
I also teased at a new artifact that many innovators have been excited about. It builds on the Maturity Model for Incubation.
One Chart to Rule Them All
Here’s a deep mapping across many of the most popular methods and models available, with a lens of how this fits into large organizations.

Models Mapped
The above chart, maps the following models:
- A modified version of the Lean Analytics method by Croll and Yoskovitz. The modifications were covered in A Maturity Model for Incubation Projects.
- The Lean Startup by Eric Ries, and some of the key concepts extracted from this.
- Zone to Win by Geoffrey Moore, which I’ve covered in previous posts like Ambidexterity: Zone to Create Breakthroughs and Growth.
- The Lean Canvas tool created by Ash Maurya, as found on his site at leanstack.com as well as his books Running Lean and Scaling Lean, both of which are excellent.
- The Technology Adoption Curve, which was coined by Everett M. Rogers and popularized by Geoffrey Moore in Crossing the Chasm.
- The Growth Pyramid model by Sean Ellis, the inventor of the near ubiquitous terms “growth hacking” and “product-market fit.”
- Pirate Metrics funnel by Dave McClure—awareness, acquisition, activation, retention, referral, revenue. So called because their abbreviation spells out AAARRR—pronounce it in your best (i.e., cheesiest) pirate accent.
Lens: Large Organizations
This model takes a particular lens, which is that of innovating within large organizations. While this mapping would be similar for the startup world, this particular chart has details specific to innovating in large organizations.
For instance:
- It includes the Zone to Win model which really only makes sense inside a larger organization.
- It includes my big org-specific mapping of the terms in Lean Analytics as covered in the referenced post. Namely, Virality is Spread and Revenue is now generalized to Impact.
- The Lean Canvas column shows the strength of applying unfair advantage earlier, whereas startups wouldn’t necessarily have unfair advantages to leverage.
Lens: Incubation
This also takes the lens of spacing out the steps of the modified Lean Analytics model evenly. That leads toward a skew that doesn’t reflect the time that this would take to really spread.
This is particularly obvious if you look at the Technology Adoption Curve column. That depicts the late majority and laggards all squished into the bottom section on “scale.” This shows that the scale phase will really last for many many years, but it’s crammed into little space. In the future, I could scale this in many difference .
Notable Omissions
You may be wondering why I’ve left out a few common models. Here’s why.
I’m considering which of Steve Blank’s models to map, whether it is the Customer Development method from his excellent 4 Steps to the Epiphany or his Investment Readiness Levels (IRLs) thermometer.
Also, as much as I love the Business Model Generation concept and the original business model canvas, I didn’t feel that it’s as strong a mapping to this timeline as the Lean Canvas. However, I like a model in their most recent book The Invincible Company. Once I get more practical experience with that, I plan to add that in.
Other omissions are either accidents, a gap in my memory, or my unfamiliarity with the models. If you think I’m missing one, please write to me in email or comments. I plan to continue updating this over time, to make it more complete.
Onward!
In the meanwhile, please enjoy!
Let me know what you think, and if you see anything missing. Dissenting opinions welcome!


May 26, 2020 @ 5:23 pm
Like!! I blog quite often and I genuinely thank you for your information. The article has truly peaked my interest.
Data Are People First - Ed Essey
June 27, 2020 @ 3:54 pm
[…] phase in the maturity model for incubation projects. It’s why I anchor to the empathy POV in the world’s top innovation models in one chart. Yes, the other terms are about people. Though, for instance, problem validation just sounds too […]